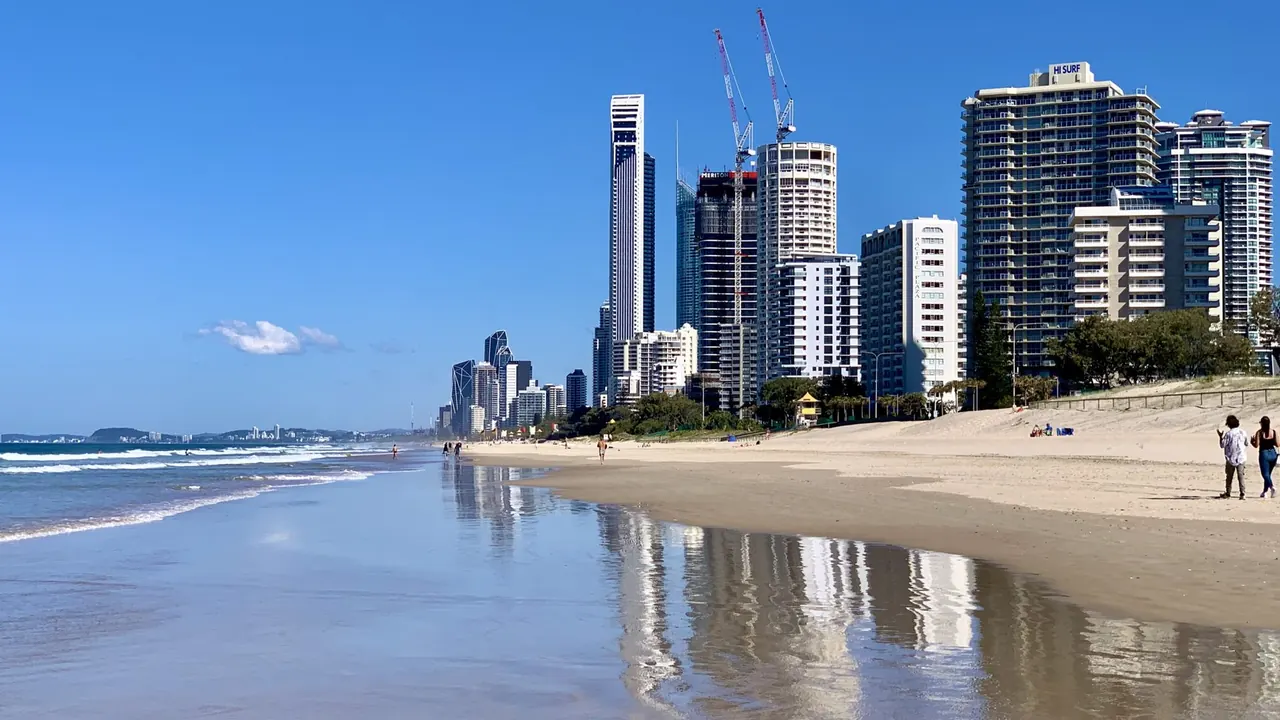
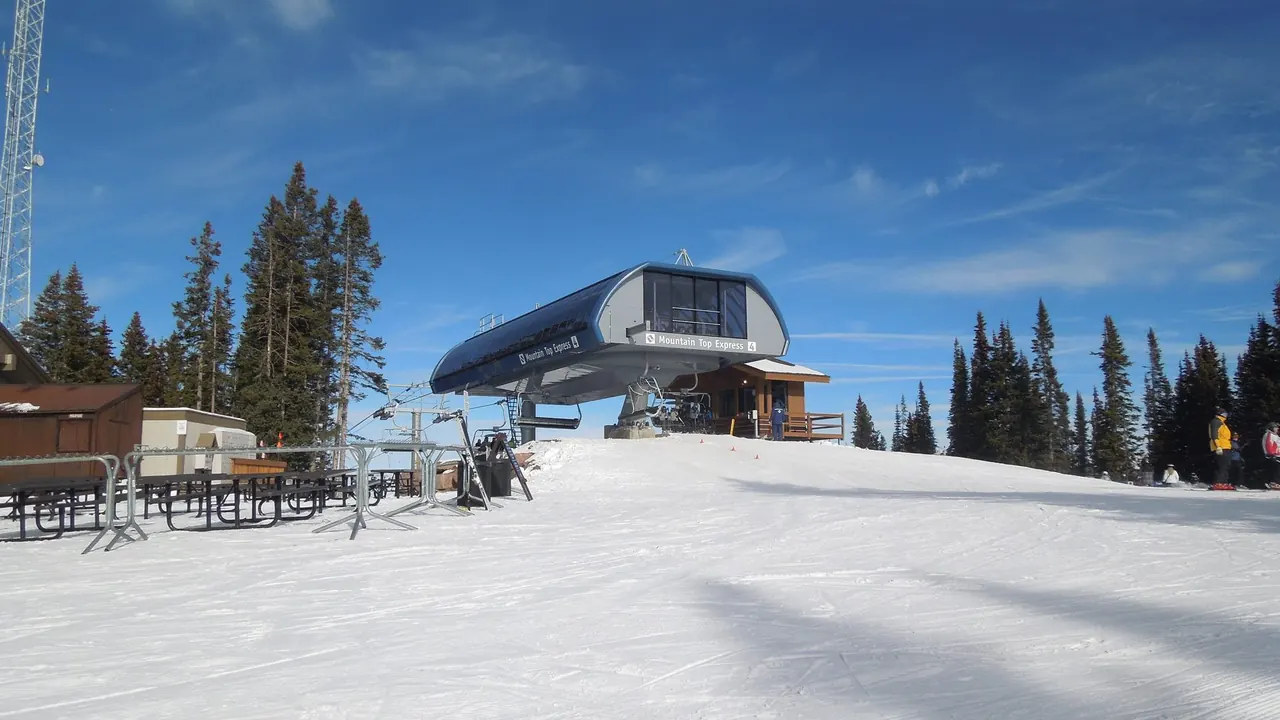
Photos: Gold Coast by Kgbo, CC BY-SA 4.0, cropped; Vail by DReifGalaxyM31, CC BY 3.0, cropped.
Gold Coast or Vail?
Our verdict in twelve categories, each scored against the same fixed benchmark cities, and the climate month by month, so you can choose for your trip.
Choose Gold Coast for
- beaches
- families
- prices
What lies behind each score is written up on Gold Coast’s own page.
Choose Vail for
- getting around
- live music and the arts
- nature and the outdoors
What lies behind each score is written up on Vail’s own page.
Scoreboard
Twelve categories on one fixed scale from 0 to 100. The shaded stretch is the gap between the two.
What lies behind each score is written up on the two cities’ own pages: Gold Coast and Vail.
Your match
Pick a travel style or drag the sliders, and both match scores follow your weighting.
Wins on beaches and families with your weighting.
Wins on getting around and live music and the arts with your weighting.
What matters to you?
When should you go?
Pick your month. The climate figures are measured averages, not a forecast.
Gold Coast in July
Vail in July
Daytime high, °C
Rainfall in the month, mm
Where the figures come from
Gold Coast's sunshine is measured 75 km from the centre, at Brisbane Airport.
Vail's temperatures are measured 47 km from the centre, at Kremmling.
Vail's station stands 186 m below the city centre, so the centre is likely a little cooler than the figures say.
Vail has no rain gauge within 25 km of the centre, so its rainfall comes from a gridded climate dataset read at the city rather than from a gauge further away.
Temperature and rainfall are climate normals, averaged over the years shown. Gold Coast: 1991-2020 normals, Gold Coast Seaway (13 km from centre). Vail: 2006-2025 (rainfall 1991-2020) normals, Kremmling (46.5 km from centre).
Before you go
| Measure | Gold Coast | Vail |
|---|---|---|
| Official language | English | - |
| Currency | Australian Dollar (AUD) | US Dollar (USD) |
| Sockets | I230 V, 50 Hz | AB120 V, 60 Hz |
| Driving side | Left | Right |
| Time zone | UTC+10 | UTC-7, UTC-6 in summer |
| Emergency number | 000 | 911 |
| Elevation | 12 m | 2,445 m |
| Main airport | Gold Coast Airport (OOL)20 km from centre19 non-stop destinations | Eagle County Regional Airport (EGE)48 km from centre16 non-stop destinations |
| Public holidays this year | 11 days | 12 days |
By the numbers
| Measure | Gold Coast | Vail |
|---|---|---|
| City population | 607,665 | 4,835 |
| People per km² | 433 | 400 |
| Museums within 10 km | 2 | 1 |
| UNESCO World Heritage sites within 50 km | 1 | 0 |
| Swim season, months above 21 °C | 12 months | - |
Where else could you go?
Every comparison below shares a destination with this one, so you can follow Gold Coast or Vail somewhere new.