
VacationSelector
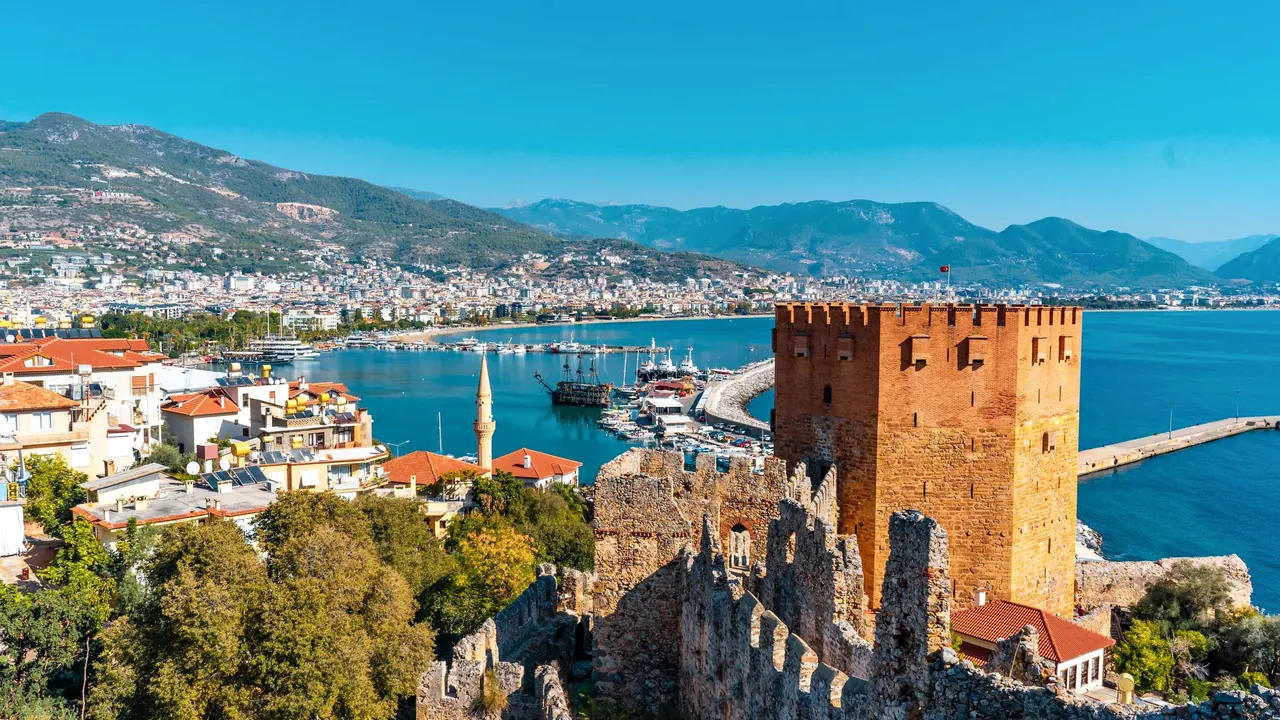
The Red Tower and the harbour, Alanya
AlanyaThe Red Tower and the harbour
The Christuskirche among palms, Windhoek
WindhoekThe Christuskirche among palms

Photos: Alanya by Atlantic Ambience, Pexels License; Windhoek by Diego Delso, CC BY-SA 4.0, cropped.

Alanya or Windhoek?

Our verdict in twelve categories, each scored against the same fixed benchmark cities, and the climate month by month, so you can choose for your trip.

Choose Alanya for

  • beaches
  • day trips
  • families

What lies behind each score is written up on Alanya’s own page.

Choose Windhoek for

  • live music and the arts

What lies behind each score is written up on Windhoek’s own page.

Scoreboard

Twelve categories on one fixed scale from 0 to 100. The shaded stretch is the gap between the two.

Beaches & swimming. Alanya 84, Windhoek 4: Alanya leads by 80 points.
Food & drink. Alanya 43, Windhoek 36: Alanya leads by 7 points.
Culture & sights. Alanya 44, Windhoek 30: Alanya leads by 14 points.
Nightlife. Alanya 58, Windhoek 25: Alanya leads by 33 points.
Nature & outdoors. Alanya 68, Windhoek 52: Alanya leads by 16 points.
Day trips. Alanya 62, Windhoek 14: Alanya leads by 48 points.
Good for families. Alanya 70, Windhoek 30: Alanya leads by 40 points.
Getting around. Alanya 50, Windhoek 22: Alanya leads by 28 points.
Shopping & style. Alanya 34, Windhoek 30: Alanya leads by 4 points.
Affordability. Alanya 65, Windhoek 62: Alanya leads by 3 points.
Live music & performing arts. Alanya 15, Windhoek 18: Windhoek leads by 3 points.
Wellness & relaxation. Alanya 56, Windhoek 30: Alanya leads by 26 points.
0255075100

What lies behind each score is written up on the two cities’ own pages: Alanya and Windhoek.

Your match

Pick a travel style or drag the sliders, and both match scores follow your weighting.

Alanya
Best match
54match

Wins on beaches and day trips with your weighting.

Windhoek
29match

Wins on live music and the arts with your weighting.

What matters to you?

When should you go?

Pick your month. The climate figures are measured averages, not a forecast.

Alanya in July

32 °Cdaytime high
27 °Cnight-time low
3 mmrain in the month
28 °Csea
14 hdaylight a day

Windhoek in July

22 °Cdaytime high
7 °Cnight-time low
1 mmrain in the month
No seasea
11 hdaylight a day

Daytime high, °C

0°10°20°30°40°JFMAMJJASOND

Rainfall in the month, mm

050100150200250JFMAMJJASOND
AlanyaWindhoek

Where the figures come from

Alanya has no weather station within reach, so its figures come from a gridded climate model rather than a measured record, and read a broad area rather than the city itself.

Temperature and rainfall are climate normals, averaged over the years shown. Alanya: 2001-2020 normals, NASA POWER reanalysis grid, no weather station within 90 km. Windhoek: 1991-2020 normals, Windhoek (1.7 km from centre).

Before you go

MeasureAlanyaWindhoek
Official languageTurkishEnglish
CurrencyTurkish Lira (TRY)Namibia Dollar (NAD)
SocketsCF230 V, 50 HzM220 V, 50 Hz
Driving sideRightLeft
Time zoneUTC+3UTC+2
Emergency number112112
Elevation10 m1,650 m
Main airportGazipaşa-Alanya Airport (GZP)38 km from centre22 non-stop destinationsHosea Kutako International Airport (WDH)41 km from centre15 non-stop destinations
Public holidays this year14 days13 days

By the numbers

MeasureAlanyaWindhoek
City population364,180486,169
People per km²22895
Museums within 10 km25
UNESCO World Heritage sites within 50 km00
Swim season, months above 21 °C7 months-

Where else could you go?

Every comparison below shares a destination with this one, so you can follow Alanya or Windhoek somewhere new.

Browse every destination

Sources

Ground elevations sampled from the Mapzen terrain tiles via OpenTopoData, merging SRTM, ASTER, NED, EU-DEM and national sources. Structured data from Wikidata (CC0). Temperature and rainfall for destinations with no weather station are from the NASA POWER 2001-2020 climatology, derived from MERRA-2. Rainfall where no rain gauge is within 25 km is from the TerraClimate 1991-2020 climatology (Abatzoglou et al. 2018, Scientific Data), read at the city. Sea surface temperature from NOAA OISST v2.1, NOAA Physical Sciences Laboratory. Airport data from OurAirports (public domain). Tourism statistics from Eurostat, © European Union, reused under CC BY 4.0. Public holidays from Nager.Date (MIT). Exchange rates via Frankfurter, based on European Central Bank reference rates. Non-stop route lists from the "Airlines and destinations" tables on English Wikipedia airport articles, by Wikipedia contributors, reused under CC BY-SA 4.0. Currency from the ISO 4217 register maintained by SIX, cross-checked against country data from GeoNames (CC BY 4.0). Price level from World Bank open data (PPP conversion factor for private consumption and official exchange rate), CC BY 4.0. Time zones from GeoNames (CC BY 4.0); clock offsets computed from the IANA time zone database. Weather data by Meteostat. Meteorological data provided by NOAA, DWD and others. Daylight hours computed from each destination's latitude using the NOAA solar position algorithm.

Category scores are our editorial verdict under rubric v3, each placed against the same fixed benchmark cities; the climate figures are measured. How the scores are set. Snapshot generated 2026-11-02. Daily budgets are estimates from country price levels.