Rovaniemi or Varanasi?
Two destinations compared in twelve categories, each scored against the same fixed benchmark cities. Weight what matters to you and the verdict follows.
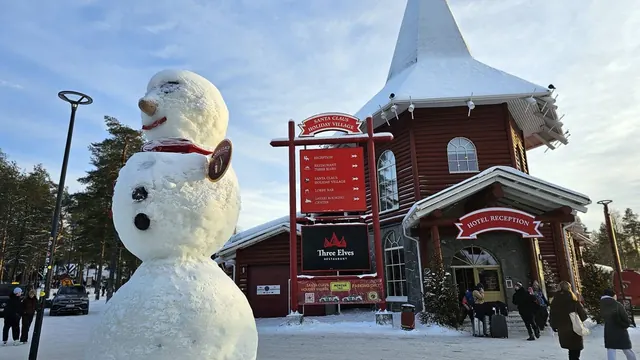
Photo: Moskenes, CC BY-SA 4.0, cropped
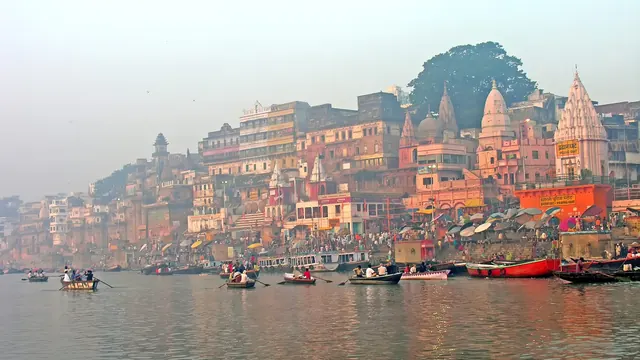
Photo: Dennis G. Jarvis, CC BY-SA 2.0, cropped
Your match
Wins on families and nature and the outdoors with your weighting.
Wins on prices and culture and sights with your weighting.
What matters to you?
Pick a travel style or drag the sliders. The match scores above update as you do.
Scoreboard
Our verdict on each category, scored 0 to 100 against fixed benchmark cities.
What lies behind each score is written up on the two cities’ own pages: Rovaniemi and Varanasi.
When should you go?
Pick the month you can travel and see both cities side by side. The climate figures are measured averages, not a forecast.
| July | Rovaniemi | Varanasi |
|---|---|---|
| Daytime high | 21 °C | 35 °C |
| Night-time low | 12 °C | 27 °C |
| Rainfall in the month | 75 mm | 249 mm |
| Daylight | 22 hours a day | 14 hours a day |
The whole year
Each row is shaded against that destination’s own year, so the deepest cell is its best month for that figure and the palest its weakest. Shades are not comparable between the two rows.
Where the figures come from
Rovaniemi's rainfall is measured 48 km from the centre, at Ylitornio Meltosjarvi / Meltosjärvi.
Varanasi has no weather station within reach, so its figures come from a gridded climate model rather than a measured record, and read a broad area rather than the city itself.
Temperature and rainfall are climate normals, averaged over the years shown. Rovaniemi: 2008-2020 (rainfall 1991-2020) normals, Rovaniemi Rautatieasema / Kuusela (0.6 km from centre). Varanasi: 2001-2020 normals, NASA POWER reanalysis grid, no weather station within 90 km.
Before you go
| Measure | Rovaniemi | Varanasi |
|---|---|---|
| Official language | Finnish, Swedish | Hindi, English |
| Currency | Euro (EUR) | Indian Rupee (INR) |
| Sockets | CF230 V, 50 Hz | CM230 V, 50 Hz |
| Driving side | Right | Left |
| Time zone | UTC+2, UTC+3 in summer | UTC+5:30 |
| Emergency number | 112 | 108 or 112 |
| Elevation | 88 m | 76 m |
| Main airport | Rovaniemi Airport (RVN)8 km from centre44 non-stop destinations | Lal Bahadur Shastri International Airport (VNS)21 km from centre16 non-stop destinations |
| Public holidays this year | 15 days | - |
By the numbers
| Measure | Rovaniemi | Varanasi |
|---|---|---|
| City population | 65,329 | 1,198,491 |
| People per km² | 9 | 14,598 |
| Museums within 10 km | 6 | 2 |
| UNESCO World Heritage sites within 50 km | 0 | 1 |
Where else could you go?
Every comparison below shares a destination with this one, so you can follow Rovaniemi or Varanasi somewhere new.