
VacationSelector
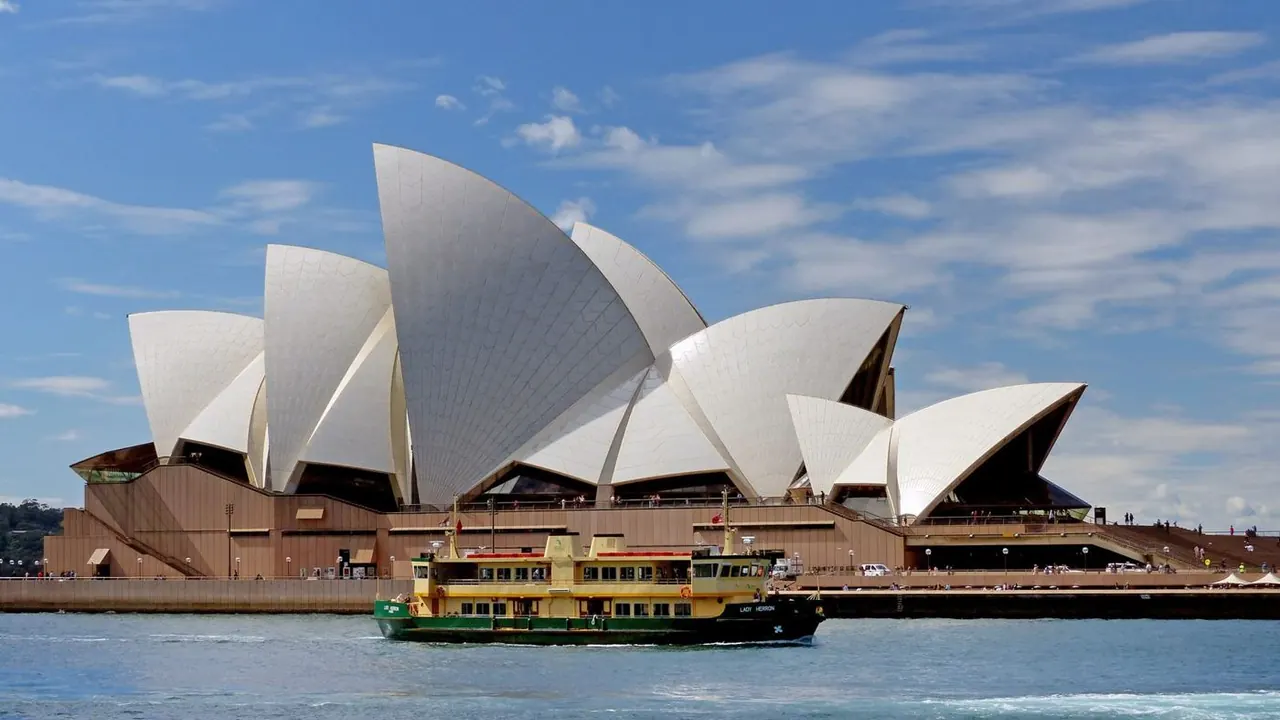
The Opera House from the water, Sydney
SydneyThe Opera House from the water
The Riverwalk and the Cape Fear Memorial Bridge, Wilmington
WilmingtonThe Riverwalk and the Cape Fear Memorial Bridge

Photos: Sydney by Bernard Spragg, CC0; Wilmington by Unexpected Snacks, CC BY-SA 4.0, cropped.

Sydney or Wilmington?

Our verdict in twelve categories, each scored against the same fixed benchmark cities, and the climate month by month, so you can choose for your trip.

Choose Sydney for

  • getting around
  • shopping
  • live music and the arts

What lies behind each score is written up on Sydney’s own page.

Choose Wilmington for

  • prices

What lies behind each score is written up on Wilmington’s own page.

Scoreboard

Twelve categories on one fixed scale from 0 to 100. The shaded stretch is the gap between the two.

Beaches & swimming. Sydney 95, Wilmington 73: Sydney leads by 22 points.
Food & drink. Sydney 77, Wilmington 48: Sydney leads by 29 points.
Culture & sights. Sydney 60, Wilmington 40: Sydney leads by 20 points.
Nightlife. Sydney 60, Wilmington 40: Sydney leads by 20 points.
Nature & outdoors. Sydney 85, Wilmington 58: Sydney leads by 27 points.
Day trips. Sydney 50, Wilmington 45: Sydney leads by 5 points.
Good for families. Sydney 75, Wilmington 62: Sydney leads by 13 points.
Getting around. Sydney 75, Wilmington 28: Sydney leads by 47 points.
Shopping & style. Sydney 68, Wilmington 33: Sydney leads by 35 points.
Affordability. Sydney 22, Wilmington 42: Wilmington leads by 20 points.
Live music & performing arts. Sydney 73, Wilmington 40: Sydney leads by 33 points.
Wellness & relaxation. Sydney 55, Wilmington 33: Sydney leads by 22 points.
0255075100

What lies behind each score is written up on the two cities’ own pages: Sydney and Wilmington.

Your match

Pick a travel style or drag the sliders, and both match scores follow your weighting.

Sydney
Best match
66match

Wins on getting around and shopping with your weighting.

Wilmington
45match

Wins on prices with your weighting.

What matters to you?

When should you go?

Pick your month. The climate figures are measured averages, not a forecast.

Sydney in July

18 °Cdaytime high
9 °Cnight-time low
70 mmrain in the month
7 hsunshine a day
19 °Csea
10 hdaylight a day

Wilmington in July

32 °Cdaytime high
23 °Cnight-time low
174 mmrain in the month
10 hsunshine a day
27 °Csea
14 hdaylight a day

Daytime high, °C

0°10°20°30°40°JFMAMJJASOND

Rainfall in the month, mm

050100150200250JFMAMJJASOND
SydneyWilmington

Temperature and rainfall are climate normals, averaged over the years shown. Sydney: 1991-2020 normals, Sydney Airport (3.7 km from centre). Wilmington: 1991-2020 normals, Wilmington / The Palms Mobile Home Park (5.3 km from centre).

Before you go

MeasureSydneyWilmington
Official languageEnglish-
CurrencyAustralian Dollar (AUD)US Dollar (USD)
SocketsI230 V, 50 HzAB120 V, 60 Hz
Driving sideLeftRight
Time zoneUTC+10, UTC+11 in summerUTC-5, UTC-4 in summer
Emergency number000911
Elevation6 m9 m
Main airportSydney Kingsford Smith International Airport (SYD)9 km from centre99 non-stop destinationsWilmington International Airport (ILM)5 km from centre25 non-stop destinations
Public holidays this year11 days14 days

By the numbers

MeasureSydneyWilmington
City population5,450,496115,451
People per km²449839
Museums within 10 km382
UNESCO World Heritage sites within 50 km20
Swim season, months above 21 °C6 months6 months

Where else could you go?

Every comparison below shares a destination with this one, so you can follow Sydney or Wilmington somewhere new.

Browse every destination

Sources

Structured data from Wikidata (CC0). Weather data by Meteostat. Meteorological data provided by NOAA, DWD and others. Rainfall where no rain gauge is within 25 km is from the TerraClimate 1991-2020 climatology (Abatzoglou et al. 2018, Scientific Data), read at the city. Sea surface temperature from NOAA OISST v2.1, NOAA Physical Sciences Laboratory. Airport data from OurAirports (public domain). Public holidays from Nager.Date (MIT). Exchange rates via Frankfurter, based on European Central Bank reference rates. Non-stop route lists from the "Airlines and destinations" tables on English Wikipedia airport articles, by Wikipedia contributors, reused under CC BY-SA 4.0. Currency from the ISO 4217 register maintained by SIX, cross-checked against country data from GeoNames (CC BY 4.0). Price level from World Bank open data (PPP conversion factor for private consumption and official exchange rate), CC BY 4.0. Time zones from GeoNames (CC BY 4.0); clock offsets computed from the IANA time zone database. Daylight hours computed from each destination's latitude using the NOAA solar position algorithm.

Category scores are our editorial verdict under rubric v3, each placed against the same fixed benchmark cities; the climate figures are measured. How the scores are set. Snapshot generated 2026-11-02. Daily budgets are estimates from country price levels.