Bologna or Milan?
Two destinations compared on nine measures of openly sourced data. Weight what matters to you and the verdict follows.
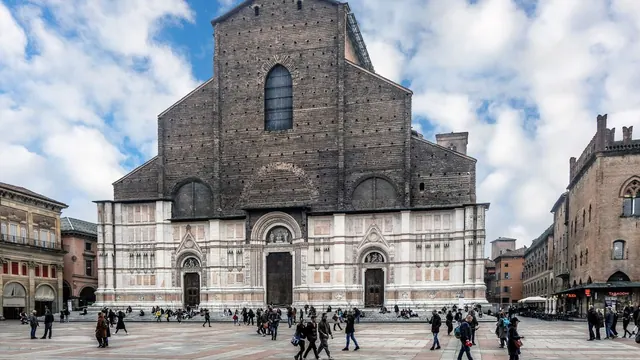
Photo: Vanni Lazzari, CC BY-SA 4.0, cropped
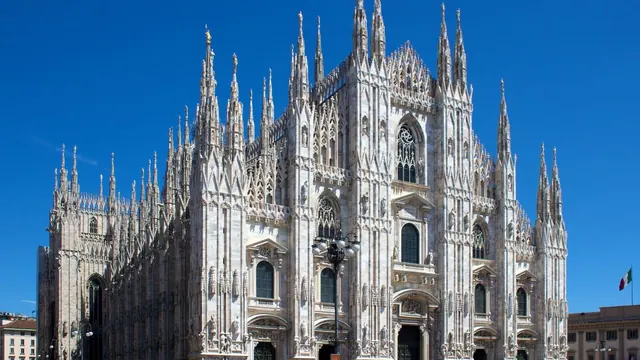
Photo: Jiuguang Wang, CC BY-SA 3.0, cropped
Your match
Wins on year-round weather with your weighting.
Wins on nature & day trips and nightlife with your weighting.
What matters to you?
Pick a travel style or drag the sliders. The match scores above update as you do.
The verdict
Choose Bologna if you want a compact, walkable trip in warmer, drier weather, with summer highs of 32°C and long stretches of low rainfall.
Choose Milan if you want more of everything urban: about twice as many restaurants and museums near the centre, far more places to drink, more attractions for children, plus theme parks and protected countryside that Bologna cannot match.
Scoreboard
Each measure scored 0 to 100. Open a row for the figures behind the score.
Beaches & swimming. Bologna and Milan are level on 0.
| Bologna | Milan | |
|---|---|---|
| Score | 0 | 0 |
| Swim season months | 0 | 0 |
| Beaches 10 km | 2 | 4 |
| Coast distance | 74 km | 120 km |
| Water distance | — | — |
Places to eat. Milan leads by 12 points.12
| Bologna | Milan | |
|---|---|---|
| Score | 58 | 70 |
| Restaurants within 2 km of centre | 822 | 1,991 |
| Effective number of cuisines within 2 km | 20 | 20 |
Museums & heritage. Milan leads by 7 points.7
| Bologna | Milan | |
|---|---|---|
| Score | 67 | 74 |
| Museums within 10 km | 58 | 87 |
| Museums within 2 km of centre | 43 | 55 |
| Share of museums within 2 km % | 74 | 63 |
| Unesco sites within 50 km | 3 | 4 |
Nightlife. Milan leads by 22 points.22
| Bologna | Milan | |
|---|---|---|
| Score | 53 | 75 |
| Drinking venues within 4 km | 720 | 2,215 |
| Drinking venues within 2 km of centre | 531 | 961 |
| Share of drinking venues within 2 km % | 74 | 43 |
| Nightclubs within 4 km | 30 | 70 |
Nature & day trips. Milan leads by 26 points.26
| Bologna | Milan | |
|---|---|---|
| Score | 39 | 65 |
| Protected land share 50 km % | 7 | 30 |
| Landscape blanket share 50 km % | 1 | 11 |
| Land share of disc % | 100 | 100 |
| Park area within 2 km | 119 hectares | 102 hectares |
Good for families. Milan leads by 22 points.22
| Bologna | Milan | |
|---|---|---|
| Score | 55 | 77 |
| Tourist attractions within 2 km | 32 | 76 |
| Park area within 2 km | 119 hectares | 102 hectares |
| Theme parks within 30 km | 0 | 5 |
Sights concentration. Milan leads by 14 points.14
| Bologna | Milan | |
|---|---|---|
| Score | 60 | 74 |
| Notable places within 2 km | 120 | 266 |
| Min wikipedia languages | 5 | 5 |
Value for money. Bologna and Milan are level on 68.
| Bologna | Milan | |
|---|---|---|
| Score | 68 | 68 |
| Price level global | 64.9 | 64.9 |
| Daily budget | €155 | €155 |
Year-round weather. Bologna leads by 3 points.3
| Bologna | Milan | |
|---|---|---|
| Score | 67 | 64 |
| Monthly daytime high | 7 °C to 31.5 °C | 7 °C to 28.6 °C |
| Monthly rainfall | 34 mm to 75 mm | 44 mm to 127 mm |
| Dry months | 5 | 0 |
Where they differ
Bologna is the warmer, drier of the two: highs of 7-32°C across the year against Milan's 7-29°C, and five months at 40mm of rain or less where Milan has none. Its centre also holds somewhat more park space.
Milan has about three times as many places to drink and twice as many nightclubs, though Bologna's cluster near the centre. It also has about twice as many tourist attractions near the centre, 5 theme parks within reach where Bologna has none, and 30% of the surrounding land protected against 7% around Bologna.
Where they are alike
Neither is a swimming destination. Both sit inland, and although a few beaches lie within reach of each, neither has a month with sea at 21°C or more, so swimming is at best a day trip rather than a reason to go.
Their calendars also line up: January highs of 7°C in both, July the warmest month in both, and heat arriving on a similar schedule. Both carry substantial museum collections, with several UNESCO-listed places within day-trip reach.
Which traveller are you?
If you want long walking days in warm, dry weather, Bologna fits better. It runs warmer through summer, up to 32°C, keeps five months at 40mm of rain or less, and has more park space near the centre.
If the evening matters most, choose Milan, with about three times as many places to drink and twice as many nightclubs. Bologna's sit more tightly around the centre, which suits anyone who prefers walking between them.
Families and day-trippers are better served in Milan: about twice as many attractions near the centre, 5 theme parks within reach where Bologna has none, and 30% of the land around it protected.
What the numbers don't tell you
The value figure is a national price level, identical for both by construction, so the comparison between these two carries no information about which trip costs less. The €155 daily budget beside it is one national estimate rather than a measurement of either city, and what you actually spend will turn on season and neighbourhood.
Milan's advantage on nature rests on the 30% of protected land around it, which lies outside the city; inside it, Bologna has the greater park space. And both list beaches nearby while neither has sea reaching 21°C, so treat that axis as a floor, not an option.
When should you go?
The figures behind each month. Each row is shaded against that destination's own year, so the deepest cell is its best month for that measure and the palest its weakest. Shades are not comparable between the two rows.
Temperature and rainfall are thirty-year climate normals, averaged over the years shown. Bologna: 1991-2020 normals, Bologna / Borgo Panigale (5.5 km from centre). Milan: 1991-2020 normals, Novara / Cameri (41.2 km from centre).
Bologna is the better pick from May to September. May and June bring highs of 24-29°C with 37-50mm of rain, and July and August reach 32°C while staying dry.
Milan peaks slightly later, in July and August at 28-29°C, though August brings 83mm. Autumn is where the two part: 116mm in September and 113mm in October in Milan, against 75mm in Bologna. Both are at their least appealing in December and January, when highs sit at 7°C.
Getting there
| Flying from | Bologna | Milan |
|---|---|---|
| LondonLHR, LGW, STN, LTN +2 | 2 h 0 m €114-267 BLQ · 6 km | 1 h 45 m €48-103 MXP · 40 km |
| CataniaCTA | 1 h 40 m €41-45 BLQ · 6 km | 1 h 55 m €36-88 MXP · 40 km |
| BarcelonaBCN | 1 h 40 m €42-75 BLQ · 6 km | 1 h 30 m €34-53 MXP · 40 km |
| ParisCDG, ORY, BVA | 1 h 40 m €158-262 1 stop BLQ · 6 km | 1 h 20 m €46-63 MXP · 40 km |
| IstanbulIST, SAW | 2 h 25 m €154-191 1 stop BLQ · 6 km | 2 h 40 m €140-309 MXP · 40 km |
| TiranaTIA | 1 h 35 m €96-199 BLQ · 6 km | 1 h 45 m €31-93 BGY · 46 km |
| New YorkJFK, EWR, LGA | 8 h 30 m €637-650 VCE · 138 km | 8 h 15 m €542-635 1 stop MXP · 40 km |
| DubaiDXB, DWC | 5 h 55 m no fares BLQ · 6 km | 6 h 10 m €375-563 MXP · 40 km |
| BeijingPEK, PKX | 9 h 55 m no fares VCE · 138 km | 10 h 10 m €710-815 1 stop MXP · 40 km |
| CancunCUN | 11 h 10 m no fares VRN · 106 km | 11 h 0 m no fares MXP · 40 km |
The busiest departure cities for these two, with a place kept for each other part of the world. Busiest means arriving passengers where an official count exists, and where none does, the number of non-stop services flown: official route statistics are published by the European reporting countries and by nobody else, so a table ranked on them alone would offer a reader in New York or Tokyo ten European cities. Flying times are estimated from the distance between airports, and every row is a city flown non-stop to both. Where the typical offer connects anyway, the stops are shown. Under each figure is the airport the flight lands at and how far that is from the centre, because the nearest airport is not always the one a route is flown to. Where both columns name the same airport it is one flight, and the difference between the two is the distance printed beside it. Typical return fares for 2026-08 to 2026-09, cached market data up to 7 days old. The figure is the middle half of the offers found, so a single price means they agreed and a range means they did not; for a typical route that middle half spans about a quarter of the median, and for the least settled routes rather more than the median itself.
Before you go
| Measure | Bologna | Milan |
|---|---|---|
| Official language | Italian | Italian |
| Currency | Euro (EUR) | Euro (EUR) |
| Sockets | CFL230 V, 50 Hz | CFL230 V, 50 Hz |
| Driving side | Right | Right |
| Time zone | UTC+1, UTC+2 in summer | UTC+1, UTC+2 in summer |
| Emergency number | 112 | 112 |
| Elevation | 54 m | 138 m |
| Main airport | Bologna Guglielmo Marconi Airport (BLQ)6 km from centre97 non-stop destinations | Milan Malpensa International Airport (MXP)40 km from centre203 non-stop destinations |
| Public holidays this year | 13 days | 13 days |
By the numbers
| Measure | Bologna | Milan |
|---|---|---|
| City population | 387,971 | 1,354,196 |
| People per km² | 2,754 | 7,453 |
| Museums within 10 km | 66 | 87 |
| UNESCO World Heritage sites within 50 km | 3 | 4 |
| Distinct cuisines in the centre | 62 | 79 |
Where else could you go?
Every comparison below shares a destination with this one, so you can follow Bologna or Milan somewhere new.