Los Angeles or New York?
Two destinations compared on nine measures of openly sourced data. Weight what matters to you and the verdict follows.
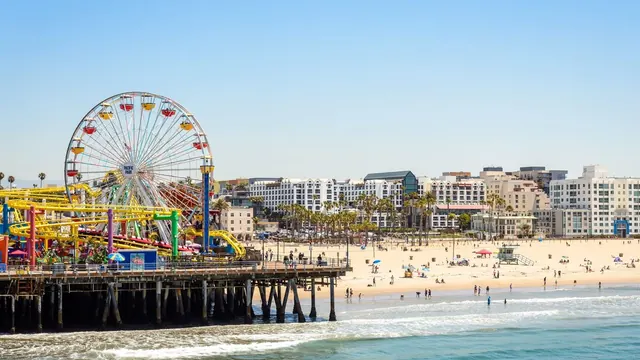
Photo: Domenico Convertini, CC BY-SA 2.0, cropped
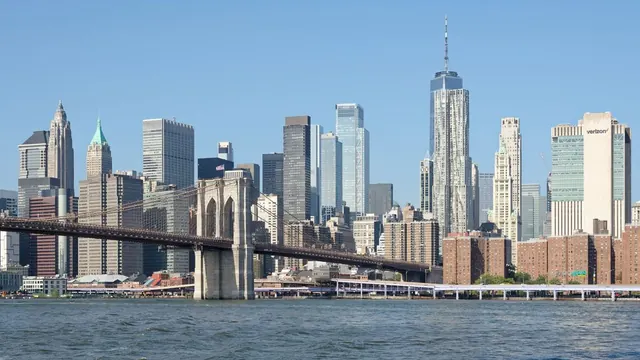
Photo: Jakub Hałun, CC BY 4.0, cropped
Your match
Wins on year-round weather and nature & day trips with your weighting.
Wins on good for families and beaches & swimming with your weighting.
What matters to you?
Pick a travel style or drag the sliders. The match scores above update as you do.
The verdict
Choose Los Angeles if you want the steadier year, daytime highs of 19-25°C, long dry spells and open country within day-trip reach.
Choose New York if the city itself is the trip: far more places to eat, far more to drink and dance, more to keep children busy, and beaches within reach in high summer.
Scoreboard
Each measure scored 0 to 100. Open a row for the figures behind the score.
Beaches & swimming. New York leads by 35 points.35
| Los Angeles | New York | |
|---|---|---|
| Score | 29 | 64 |
| Beaches 25 km | 11 | — |
| Beaches 10 km | 0 | 17 |
| Swim season months | 0 | 3 |
| Warmest sea temp | 20.2 °C | — |
| Scoring variant | beachScoreWideRing | — |
| Declared | 2026-08-25 | — |
| Register | seed/editorial-overrides.json | — |
| Coast distance | — | 1 km |
| Water distance | — | 1 km |
Places to eat. New York leads by 29 points.29
| Los Angeles | New York | |
|---|---|---|
| Score | 66 | 95 |
| Restaurants within 2 km of centre | 1,337 | 6,032 |
| Effective number of cuisines within 2 km | 22 | 38 |
Museums & heritage. New York leads by 11 points.11
| Los Angeles | New York | |
|---|---|---|
| Score | 49 | 60 |
| Museums within 10 km | 69 | 119 |
| Museums within 2 km of centre | 23 | 31 |
| Share of museums within 2 km % | 33 | 26 |
| Unesco sites within 50 km | 1 | 2 |
Nightlife. New York leads by 35 points.35
| Los Angeles | New York | |
|---|---|---|
| Score | 54 | 89 |
| Drinking venues within 4 km | 660 | 4,159 |
| Drinking venues within 2 km of centre | 432 | 2,015 |
| Share of drinking venues within 2 km % | 65 | 48 |
| Nightclubs within 4 km | 64 | 192 |
Nature & day trips. Los Angeles leads by 23 points.23
| Los Angeles | New York | |
|---|---|---|
| Score | 62 | 39 |
| Protected land share 50 km % | 26 | 4 |
| Landscape blanket share 50 km % | 0 | 0 |
| Land share of disc % | 80 | 69 |
| Park area within 2 km | 20 hectares | 134 hectares |
Good for families. New York leads by 39 points.39
| Los Angeles | New York | |
|---|---|---|
| Score | 33 | 72 |
| Tourist attractions within 2 km | 11 | 37 |
| Park area within 2 km | 20 hectares | 134 hectares |
| Theme parks within 30 km | 2 | 7 |
Sights concentration. New York leads by 20 points.20
| Los Angeles | New York | |
|---|---|---|
| Score | 54 | 74 |
| Notable places within 2 km | 88 | 268 |
| Min wikipedia languages | 5 | 5 |
Value for money. Los Angeles and New York are level on 43.
| Los Angeles | New York | |
|---|---|---|
| Score | 43 | 43 |
| Price level global | 100 | 100 |
| Daily budget | — | — |
Year-round weather. Los Angeles leads by 29 points.29
| Los Angeles | New York | |
|---|---|---|
| Score | 87 | 58 |
| Monthly daytime high | 18.6 °C to 24.7 °C | 4.5 °C to 30.1 °C |
| Monthly rainfall | 0 mm to 76 mm | 74 mm to 112 mm |
| Dry months | 8 | 0 |
Where they differ
Los Angeles holds daytime highs of 19-25°C year-round against New York's 5-30°C, and has eight months at 40mm of rain or less where New York has none. Its surroundings are wilder, 26% protected land against 4%.
New York has many times as many restaurants near the centre and a wider range of kitchens, many times as many places to drink and far more nightclubs. It also has many more attractions near the centre, more theme parks within reach, and 17 beaches nearby where Los Angeles has none.
Where they are alike
Museums and heritage come out closest. Both cities have a substantial museum stock, New York roughly double, and both have UNESCO-listed places within day-trip reach, 2 from New York and 1 from Los Angeles.
Beyond that, both give you a walkable core of notable places, denser in New York, and both offer somewhere to go beyond the city: protected land at a distance around Los Angeles, park space closer in around New York.
Which traveller are you?
If you are going for restaurants and late nights, New York: many times as many places to eat, a much wider range of kitchens, many more bars and clubs, with about half of the nightlife near the centre.
Travelling with children also points to New York: many more attractions near the centre, far more park space, 7 theme parks within reach against 2, and 17 beaches nearby for the summer months.
Anyone building the trip around day trips and mild weather should take Los Angeles: 26% of the surrounding land is protected, and highs sit at 19-25°C with long rain-free stretches.
What the numbers don't tell you
No cost comparison is possible here. The dataset carries no daily budget for either city, and the value figure behind both is a national price level, identical for the two by construction. It tells you nothing about which trip costs more, so treat the two as unranked on money.
The weather comparison is also incomplete: no nearby station records sunshine hours for either city, so that side is unmeasured rather than poor. And New York's beach count flatters it: the sea reaches 21°C or more in only three months, and every month carries close to 100mm of rain.
When should you go?
The figures behind each month. Each row is shaded against that destination's own year, so the deepest cell is its best month for that measure and the palest its weakest. Shades are not comparable between the two rows.
Temperature and rainfall are thirty-year climate normals, averaged over the years shown. Los Angeles: 1991-2020 normals, Los Angeles Airport (18.5 km from centre). New York: 1991-2020 normals, LaGuardia Airport (12.9 km from centre).
Los Angeles is best from July to October, with highs of 24-25°C, sea near 20°C and rainfall of 0-13mm, so beach days are reliable. Spring is dry and mild too; the wet weeks fall in January and February.
New York works in May, June and September, with highs of 22-27°C and late summer the only stretch when the sea is properly warm. Rain falls all year, close to 100mm in most months, so it is never the dry choice, and winter is genuinely cold.
Getting there
| Flying from | Los Angeles | New York |
|---|---|---|
| ChicagoORD, MDW, DPA, PWK +1 | 4 h 0 m no fares LAX · 19 km | 2 h 5 m €236-237 LGA · 13 km |
| WashingtonIAD, DCA | 5 h 0 m €196-293 1 stop LAX · 19 km | 1 h 5 m €203-258 LGA · 13 km |
| TokyoHND, NRT | 11 h 0 m €785-892 1 stop LAX · 19 km | 13 h 30 m €989-1136 JFK · 21 km |
| DenverDEN, APA | 2 h 20 m no fares LAX · 19 km | 3 h 45 m no fares LGA · 13 km |
| DallasDFW, DAL, AFW | 3 h 0 m €188-208 LAX · 19 km | 3 h 20 m €201-385 LGA · 13 km |
| OrlandoMCO, SFB, ORL | 4 h 50 m €205-248 1 stop LAX · 19 km | 2 h 30 m €207-260 LGA · 13 km |
| AtlantaATL, PDK | 4 h 20 m €288 LAX · 19 km | 2 h 5 m €165-236 EWR · 14 km |
| ParisCDG, ORY, BVA | 11 h 25 m €600-640 1 stop LAX · 19 km | 7 h 30 m €445-517 JFK · 21 km |
| Mexico CityMEX, NLU, TLC | 3 h 35 m €261-303 1 stop LAX · 19 km | 4 h 40 m €374-446 1 stop JFK · 21 km |
| Tel Aviv YafoTLV | 15 h 0 m no fares LAX · 19 km | 11 h 25 m €622-836 1 stop JFK · 21 km |
The busiest departure cities for these two, with a place kept for each other part of the world. Busiest means arriving passengers where an official count exists, and where none does, the number of non-stop services flown: official route statistics are published by the European reporting countries and by nobody else, so a table ranked on them alone would offer a reader in New York or Tokyo ten European cities. Flying times are estimated from the distance between airports, and every row is a city flown non-stop to both. Where the typical offer connects anyway, the stops are shown. Under each figure is the airport the flight lands at and how far that is from the centre, because the nearest airport is not always the one a route is flown to. Where both columns name the same airport it is one flight, and the difference between the two is the distance printed beside it. Typical return fares for 2026-08 to 2026-10, cached market data up to 7 days old. The figure is the middle half of the offers found, so a single price means they agreed and a range means they did not; for a typical route that middle half spans about a quarter of the median, and for the least settled routes rather more than the median itself.
Before you go
| Measure | Los Angeles | New York |
|---|---|---|
| Currency | US Dollar (USD) | US Dollar (USD) |
| Sockets | AB120 V, 60 Hz | AB120 V, 60 Hz |
| Driving side | Right | Right |
| Time zone | UTC-8, UTC-7 in summer | UTC-5, UTC-4 in summer |
| Emergency number | 911 | 911 |
| Elevation | 106 m | 25 m |
| Main airport | Los Angeles International Airport (LAX)19 km from centre180 non-stop destinations | John F. Kennedy International Airport (JFK)21 km from centre188 non-stop destinations |
| Public holidays this year | 13 days | 13 days |
By the numbers
| Measure | Los Angeles | New York |
|---|---|---|
| City population | 3,898,747 | 8,804,190 |
| People per km² | 2,994 | 7,256 |
| Museums within 10 km | 38 | 157 |
| UNESCO World Heritage sites within 50 km | 1 | 2 |
| Distinct cuisines in the centre | 46 | 132 |
| Swim season, months above 21 °C | None | 3 months |
Where else could you go?
Every comparison below shares a destination with this one, so you can follow Los Angeles or New York somewhere new.